Image:Five Myr Climate Change.png
From Wikipedia, the free encyclopedia

Five_Myr_Climate_Change.png (745 × 224 pixel, file size: 22 KB, MIME type: image/png)
Description

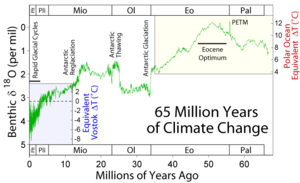
This figure shows the climate record of Lisiecki and Raymo (2005) constructed by combining measurements from 57 globally distributed deep sea sediment cores. The measured quantity is oxygen isotope fractionation in benthic foraminifera, which serves as a proxy for the total global mass of glacial ice sheets.
Lisiecki and Raymo constructed this record by first applying a computer aided process of adjusting individual "wiggles" in each sediment core to have the same alignment (i.e. wiggle matching). Then the resulting stacked record is orbitally tuned by adjusting the positions of peaks and valleys to fall at times consistent with an orbitally driven ice model (see: Milankovitch cycles). Both sets of these adjustments are constrained to be within known uncertainties on sedimentation rates and consistent with independently dated tie points (if any). Constructions of this kind are common, however they presume that ice sheets are orbitally driven, and hence data such as this can not be used in establishing the existence of such a relationship.
The observed isotope variations are very similar in shape to the temperature variations recorded at Vostok, Antarctica during the 420 kyr for which that record exists. Hence the right hand scale of the figure was established by fitting the reported temperature variations at Vostok (Petit et al. 1999) to the observed isotope variations. Hence, this temperature scale should be regarded as approximate and its magnitude is only representative of Vostok changes. In particular, temperature changes at polar sites, such as Vostok, frequently exceed the changes observed in the tropics or in the global average. A horizontal line at 0 °C indicates modern temperatures (circa 1950).
Labels are added to indicate regions where 100 kyr and 41 kyr cyclicity is observed. These periodicities match periodic changes in Earth's orbital eccentricity and obliquity respectively, and have been previously established by other studies (not relying on orbital tuning). For discussion of how such orbital changes might drive climate change, see Milankovitch cycles.
Copyright
This figure was prepared by Robert A. Rohde based on published data and is incorporated into the Global Warming Art project.
This image is an original work created for Global Warming Art.
Permission is granted to copy, distribute and/or modify this image under either:
- The GNU Free Documentation License Version 1.2; with no Invariant Sections, Front-Cover Texts, or Back-Cover Texts.
- The Creative Commons Attribution-NonCommercial-ShareAlike License Version 2.5
Please refer to the image description page on Global Warming Art for more information
- http://www.globalwarmingart.com/wiki/Image:Five_Myr_Climate_Change.png
References
- Lisiecki, L. E., and M. E. Raymo (2005), A Pliocene-Pleistocene stack of 57 globally distributed benthic δ18O records, Paleoceanography, 20, PA1003, doi:10.1029/2004PA001071.
- Petit J.R., Jouzel J., Raynaud D., Barkov N.I., Barnola J.M., Basile I., Bender M., Chappellaz J., Davis J., Delaygue G., Delmotte M., Kotlyakov V.M., Legrand M., Lipenkov V., Lorius C., Pépin L., Ritz C., Saltzman E., Stievenard M. (1999) Climate and Atmospheric History of the Past 420,000 years from the Vostok Ice Core, Antarctica, Nature, 399, pp.429-436.
| Dragons flight's Temperature Record Series |
| This figure is part of series of plots created by Dragons flight to illustrate changes in Earth's temperature and climate across many different time scales. |
| Time Period: 25 yrs | 150 yrs | 1 kyr | 2 kyr | 12 kyr | 450 kyr | 5 Myr | 65 Myr | 500 Myr |
| For articles related to this topic see: Temperature record |
File history
Legend: (cur) = this is the current file, (del) = delete this old version, (rev) = revert to this old version.
Click on date to download the file or see the image uploaded on that date.
- (del) (cur) 04:40, 6 March 2005 . . Dragons flight ( Talk | contribs) . . 745×224 (22,795 bytes) (Glacial Cycles as Recorded in Sediment Cores)
-
Edit this file using an external application
See the setup instructions for more information.
File links
- Ice age
- Temperature record
- Geologic temperature record
- User:Dragons flight/Images
- Image:Ice Age Temperature.png
- Image:65 Myr Climate Change.png
Category: Global Warming Art images