Image:Global Warming Map.jpg
From Wikipedia, the free encyclopedia

Global_Warming_Map.jpg (571 × 406 pixel, file size: 77 KB, MIME type: image/jpeg)
Contents |
Description

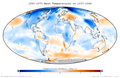
This figure shows the difference in instrumentally determined surface temperatures between the period January 1995 through December 2004 and "normal" temperatures at the same locations, defined to be the average over the interval January 1940 to December 1980. The average increase on this graph is 0.42 °C, and the widespread temperature increases are considered to be an aspect of global warming.
Data source
This plot is based on the NASA GISS Surface Temperature Analysis (GISTEMP), which combines the 2001 GISS land station analysis data set (Hansen et al. 2001) with the Rayner/Reynolds oceanic sea surface temperature data set (Rayner 2000, Reynolds et al. 2002). The data itself was prepared through the GISTEMP online mapping tool, and the specific dataset used is available here. This data was replotted in a Mollweide projection with a continuous and symmetric colour scale. The smoothing radius is 1200 km, meaning that the reported temperature may depend on measurement stations located up to 1200 km away, if necessary. dsf
Related images
 Global cooling of 1965-74
|
Copyright
This figure was prepared by Robert A. Rohde from public domain data and is incorporated into the Global Warming Art project.
This image is an original work created for Global Warming Art.
Permission is granted to copy, distribute and/or modify this image under either:
- The GNU Free Documentation License Version 1.2; with no Invariant Sections, Front-Cover Texts, or Back-Cover Texts.
- The Creative Commons Attribution-NonCommercial-ShareAlike License Version 2.5
Please refer to the image description page on Global Warming Art for more information
- http://www.globalwarmingart.com/wiki/Image:Global_Warming_Map.jpg
References
- Hansen, J., R. Ruedy, M. Sato, M. Imhoff, W. Lawrence, D. Easterling, T. Peterson, and T. Karl (2001). "A closer look at United States and global surface temperature change". J. Geophys. Res 106: 23947-23963.
- Rayner, N. (2000) HadISST1 Seaice and sea surface temperature files. Hadley Centre, Bracknell, UK
- Reynolds, R.W., N.A. Rayner, T.M. Smith, D.C. Stokes, and W. Wang (2002). "An improved in situ and satellite SST analysis for climate". J. Climate 15: 1609-1625. DOI: <1609:AIISAS>2.0.CO;2 10.1175/1520-0442(2002)015<1609:AIISAS>2.0.CO;2
File history
Legend: (cur) = this is the current file, (del) = delete this old version, (rev) = revert to this old version.
Click on date to download the file or see the image uploaded on that date.
- (del) (cur) 04:00, 13 July 2005 . . Dragons flight ( Talk | contribs) . . 571×406 (78,382 bytes) (Map of global warming temperature changes. {{GFDL}})
-
Edit this file using an external application
See the setup instructions for more information.
File links
- Pacific decadal oscillation
- User:Dragons flight/Images
- Portal:Science/Featured article
- Portal:Geography
- User:Ragesoss/template
- Portal:Geography/Featured article/archive
- Global warming
- User talk:Blue Tie/Article to work
- Portal:Science/Featured article/18
- User:Uriel8
- Portal:Geography/Featured article/April, 2007
Categories: Global Warming Art images | Images of map projections